Overview
For this project, I developed a web-based tool to transform raw public health survey data from Ohio counties into an accessible, interactive visual format, allowing people to easily grasp how differnet data points correlated.
Relevant Skills
Data Ingestion & Processing, Visualization & Rendering, UX Design, Front-End Devleopment, Object Oriented Programming, Javascript, p5.js Library.
Process
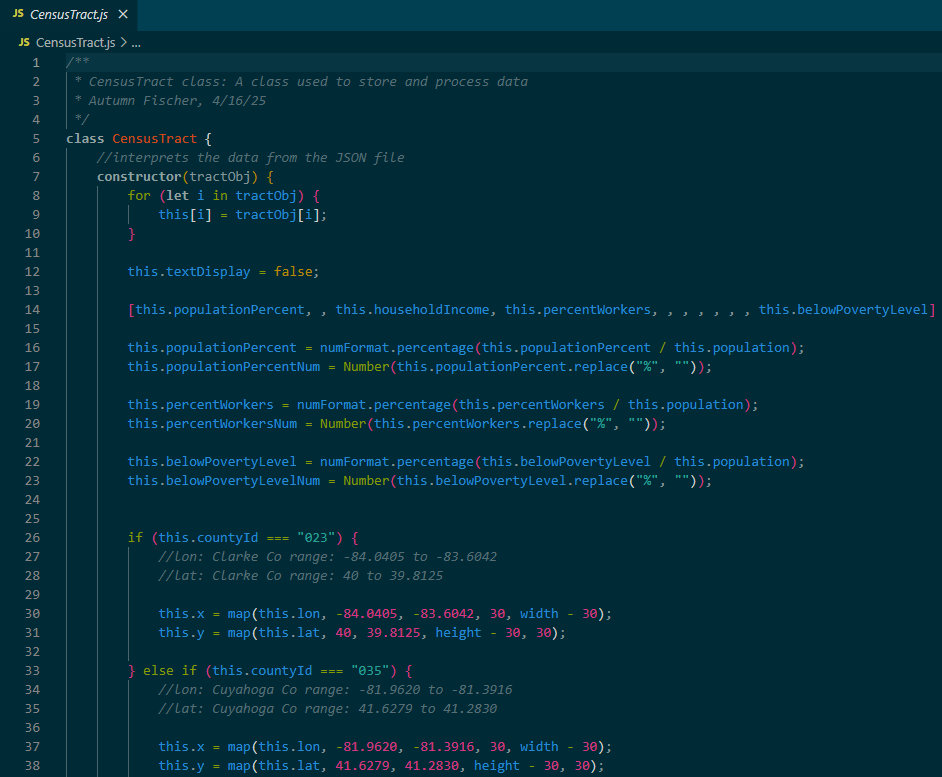
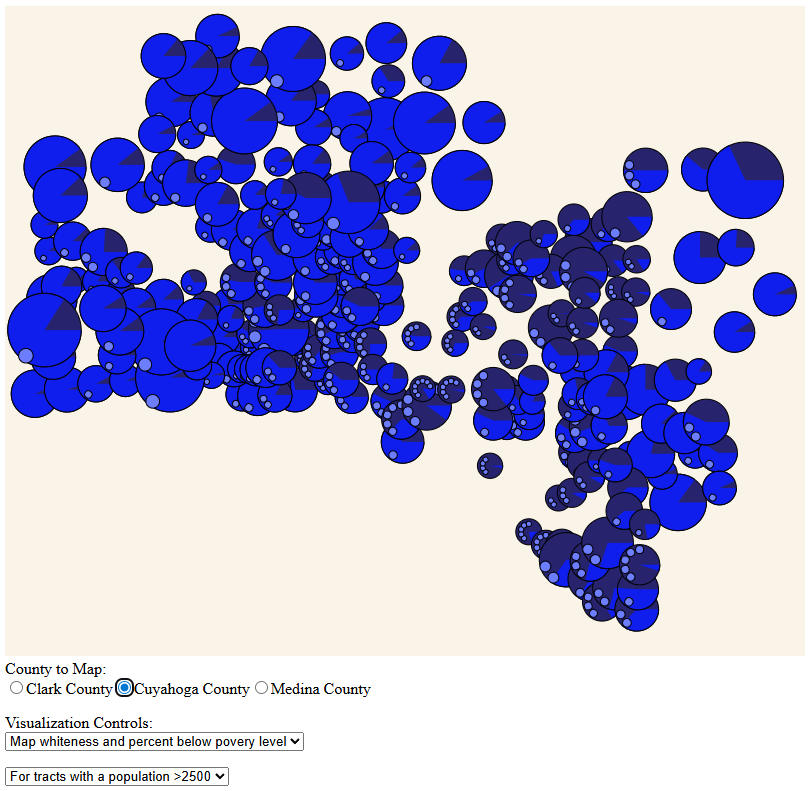
The core part of this project was data ingestion and analysis. I began by parsing a large, multi-variable JSON file, selecting a focused subset of health data. I took this data and stored it in simplified variables so that it would be easy to develop a visualization. To keep my code organized and simple, I utilized an object-oriented architecture. The program was made up of two distinct JavaScript classes: one dedicated to data handling and the other dedicated to the interface and user interaction. For the visualization itself, I used p5.js to render clear, concise graphics.The user can interact with standard HTML DOM elements to change both the displayed health metric and the mapped county.